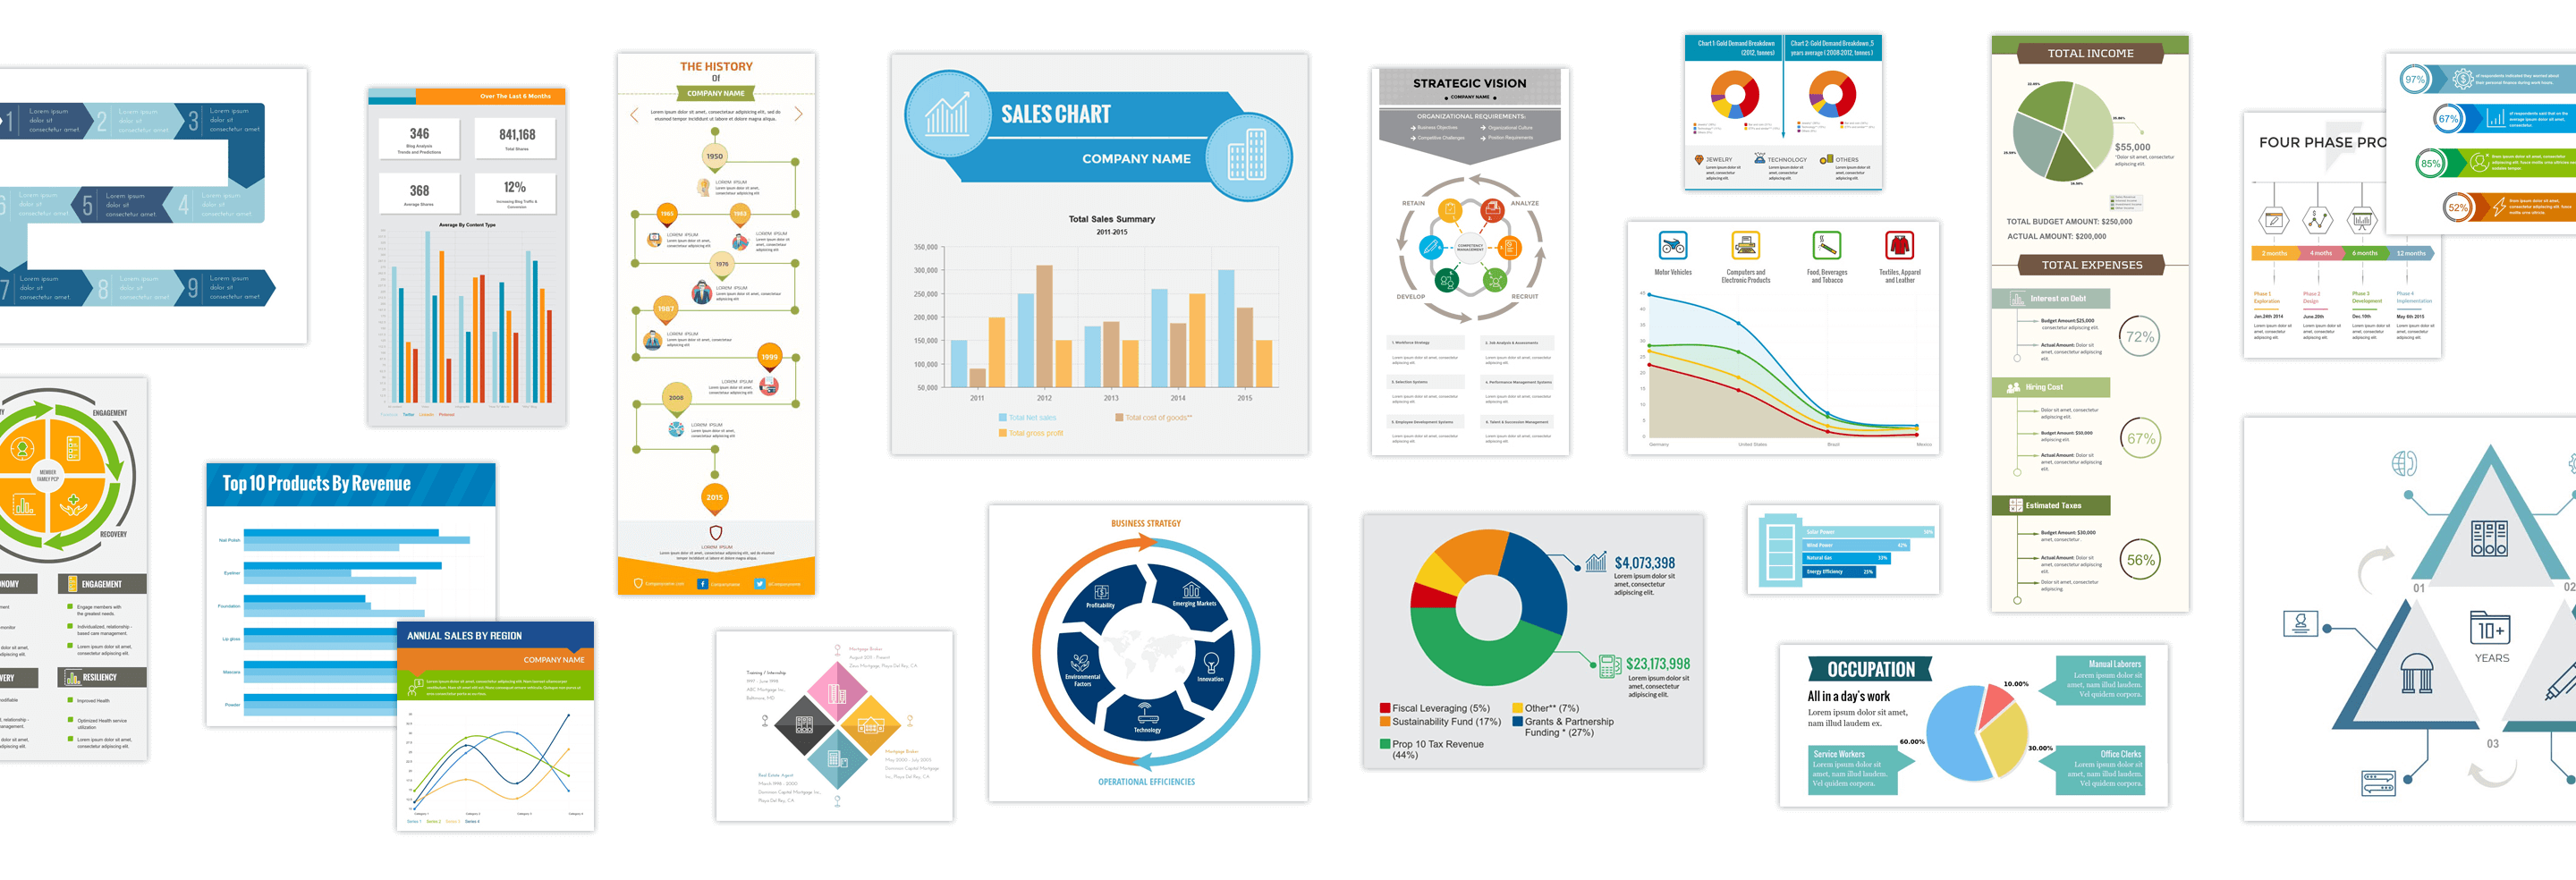
Turn ordinary sales and marketing information and reports into powerful visual stories.
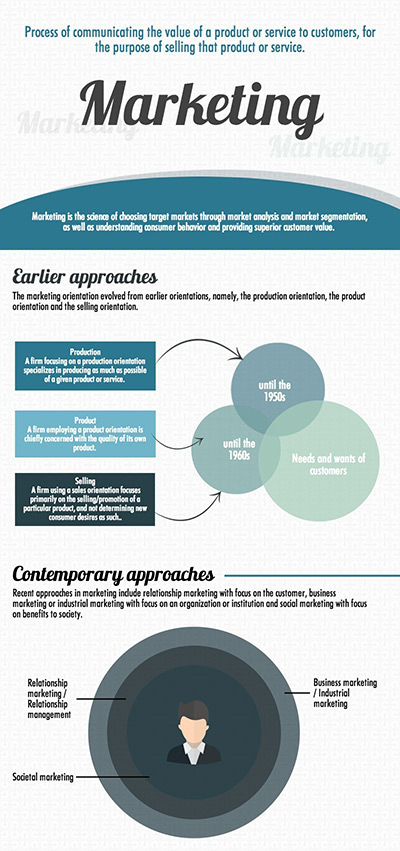
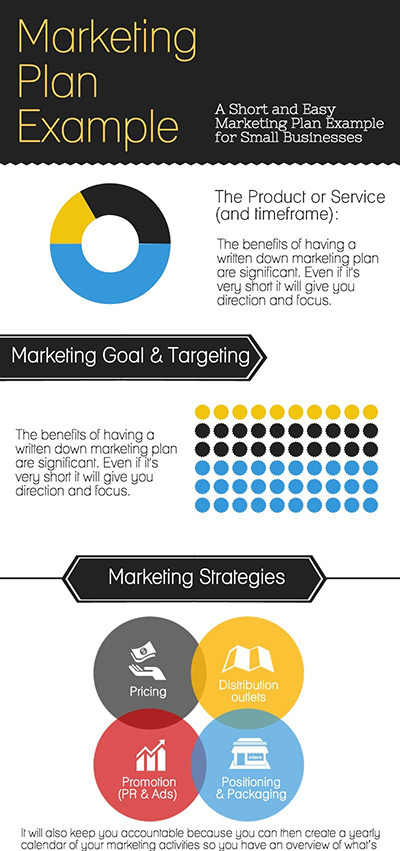
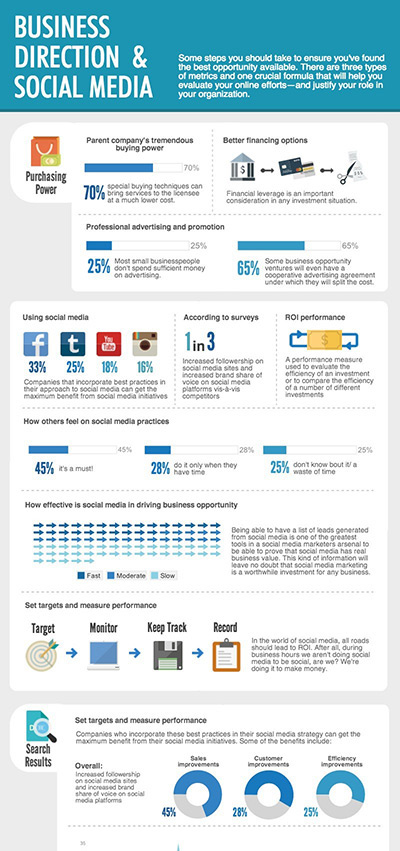
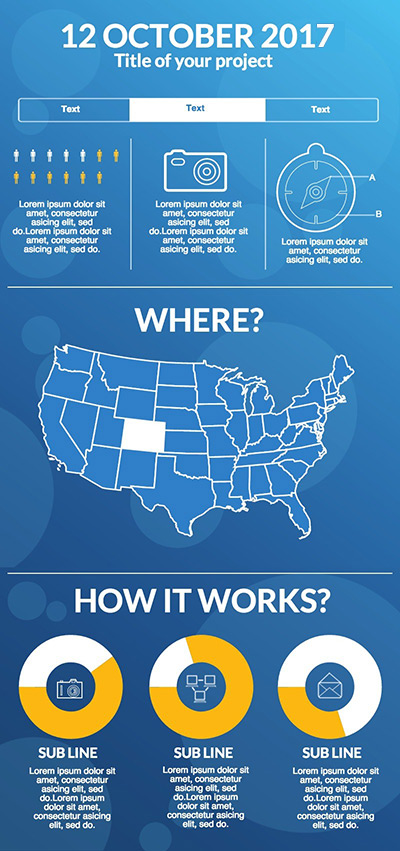
Infographics
Information graphics or infographics are graphic visual representations of information, data or knowledge intended to present information quickly and clearly. Provide me with your text and a few instructions and I’ll transform what you send me into an interesting infographic for displaying on your website or in social media posts.
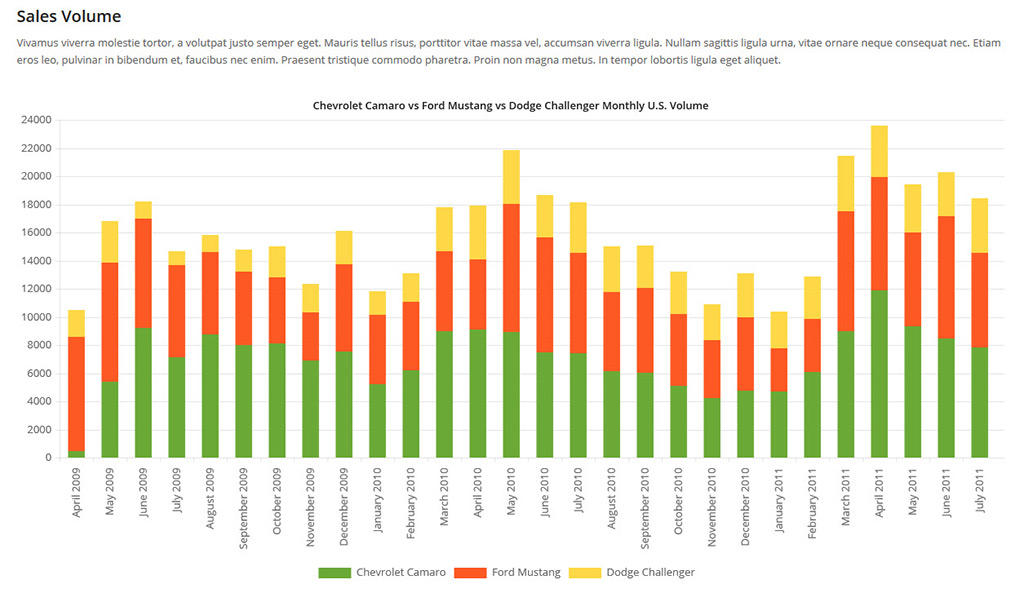
Charts
Send me a spreadsheet that includes the data and your preferred chart type – line, area, bar, horizontal bar, pie, doughnut, radar, polar area, scatter, bubble. I’ll then set up the chart and display it on your site. From then on, changes can be made via a user-friendly interface in the back-end of your website. They will be immediately reflected on the chart that’s displayed to website visitors on the front-end.